![]() Click the red "+" below your farm fields to get detailed statistics for each field for current and past years.
Click the red "+" below your farm fields to get detailed statistics for each field for current and past years.

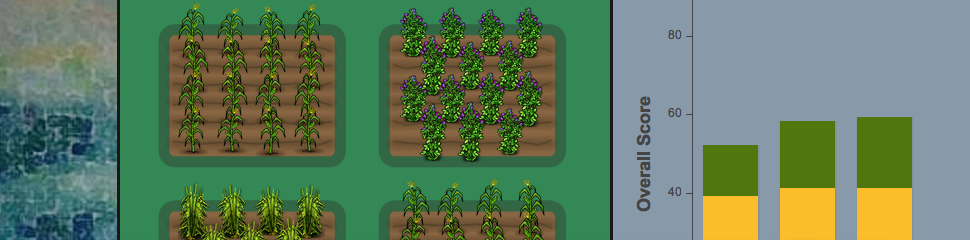
Explore your planting/management decisions and environment, energy and economics scores and data for each field. Color indicates how well you are doing in each category.
The icons in the upper left of each field tell you what you planted and what fertilizer level or tillage was used for a given year. The overlaid numbers provide scores and data for the field for the category selected (environment, energy, or economy).
The field color ranging from red to green gives an overall indication of how well each field is doing in the chosen score category for that year (green = good, red = bad). Use the scroll arrows to see data on different years and use the check boxes to view data in the chosen category.
Planting and Management Decisions & History
Use scroll arrows to review your planting and management decisions for each field in current and past years. The crop you planted and your management decisions for the given year will be displayed in the top left corner of each field. As you scroll through different years, you can also review environmental, energy and economic data for fields as described below. Note: You will only see management icons for fertilizer and tillage if you tilled your fields and/or added fertilizer. Otherwise, no icons will appear indicating tillage and/or fertilizer was not used.
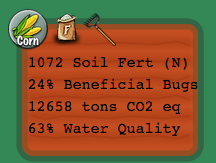
Environmental Scores & Data
Check the "Environment" box to view current and past information about each field's environmental conditions. The field color, ranging green to red, gives an indication the field's environmental score (green = good, red = poor). The field color represents an average of soil fertility, beneficial bugs (biodiversity), greenhouse gas emissions, and water quality.
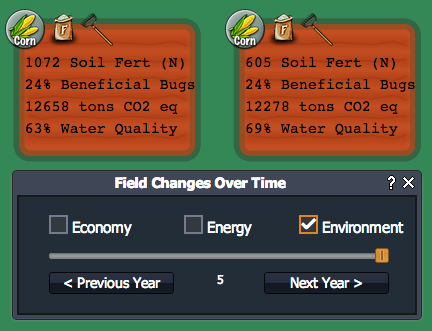
Icons for crops, fertilizer levels, and tillage give a history of planting and field management choices. Scroll through previous years to see choices and related data.
Field color (green=good, red=bad) indicates your fields overall environmental condition. Scores & data give info on environmental components.
You will also see data or scores for each of these environmental categories:
- Soil Fertility ("Soil Fert"): the amount of available nitrogen in your field's soil. Nitrogen is required for crops to grow but too much can pollute the water (nitrate leaching) and produce greenhouse gas emissions (nitrous oxide).
- Beneficial Bugs: indicator of bug biodiversity ranging from 0-100%. This score is affected by both the crop in the field and neighboring fields. Beneficial bugs help protect your crops from pests.
- Greenhouse Gas Emissions ("tons CO2 eq"): how much greenhouse gas is emitted in the process of growing crops and converting them into fuel.
- Water Quality: indicator of quality of water running off the field based upon nitrate leaching from fertilizer and the soil (range 0-100%).
For more information on the units of these measurements and how they are calculated, visit the corresponding environmental model section.
Energy Production & Crop Yield
Check the "Energy" box to view current and past data on each field's crop yield and net energy production per an acre. The field color, ranging green to red, gives an indication the how much net energy in fuel your farm is producing in comparison to what is possible (green = good, red = poor).
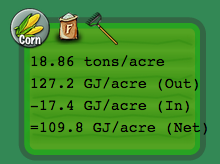
The energy production by field is broken into four categories, line by line, as follows:
- Yield (tons/acre): how much crop biomass was harvested and sold from your field.
- Total energy in fuel (GJ/acre): the amount of chemical energy in the liquid biofuel (ethanol) produced from the crop biomass, in units gigajoules per acre.
- Total energy inputs (GJ/acre): how much energy was required to grow, harvest, transport and convert the crop biomass into ethanol fuel, measured in gigajoules per acre. Inputs include fertilizer production, running tractors and biofuel plant operation.
- Net energy (GJ/acre): how much net energy is produced in converting the harvested crop biomass into fuel. Calculated by subtracting the energy inputs from the energy content of the biofuel produced from the crop.
For more information on the units of these measurements and how they are calculated, visit the corresponding energy model section.
Economic Data: Price, Costs, Revenue and Income
Click the "Economy" check box to view current and past data on each field's economic performance The field color, ranging green to red, gives an indication the how much money you are making from each field in comparison to what is possible (green = good, red = poor).
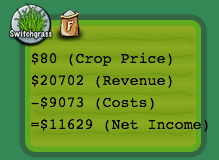
You will see numbers on each field that break down, line by line, the costs and revenue from growing a crop for a given year:
- Crop price: price paid per a ton for crop biomass.
- Revenue: total money made by selling crops biomass harvested from the field.
- Costs: the costs associated with planting, growing and harvesting crop, such as fuel, fertilizer, chemicals, etc.
- Net income: how much money you made from that field for that year after subtracting production costs.
For more information on the units of these measurements and how they are calculated, visit the corresponding economic model section.
See also: Farm Scores and Graphs